Remote Debugger
The Remote Debugger functionality allows the Kreo programmer to debug the so-called script (ST Structured Text) present in the Kreo project.
The first operation to carry out is to download the project to the target product and run it.
Once the project is running the user must open the Tools menu and select Remote Debugger.
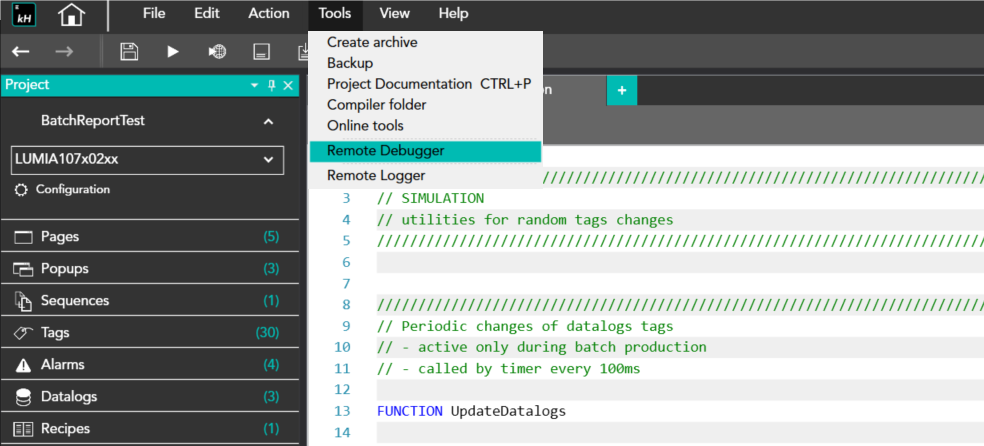
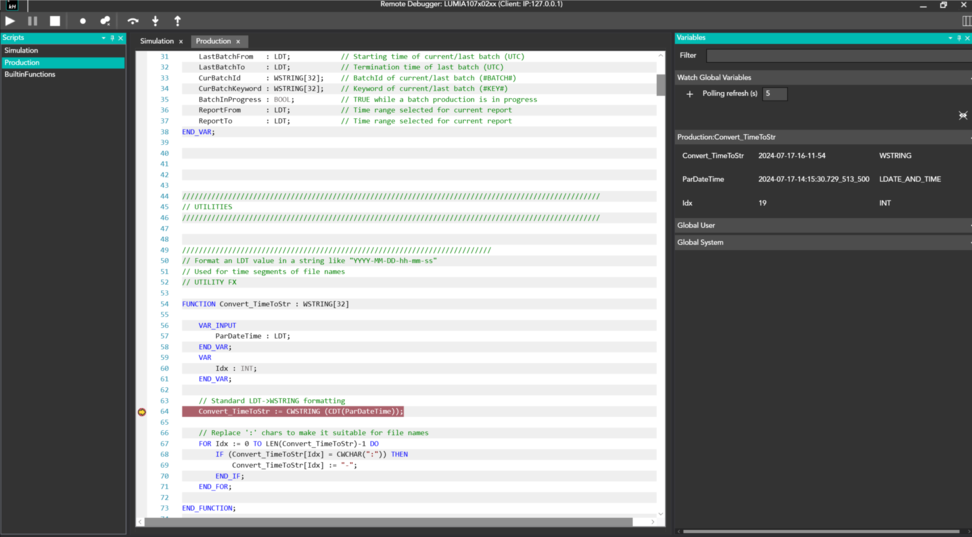
At this point a dedicated console will open which is made up of the following parts:
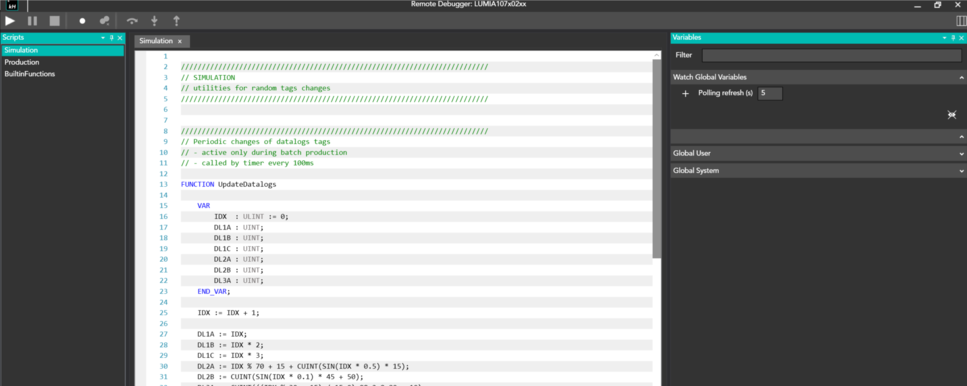
At the top is the command toolbar
The area on the left presents the list of application scripts of the project and a system script, Built in functions, within which all the system functions are found.
The window on the right is dedicated to displaying the value of the Tags.
Command Toolbar
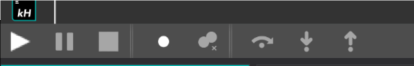
The available commands are the following:
PLAY. Force start the debug session
When the user presses PLAY the following pop_up window appears:
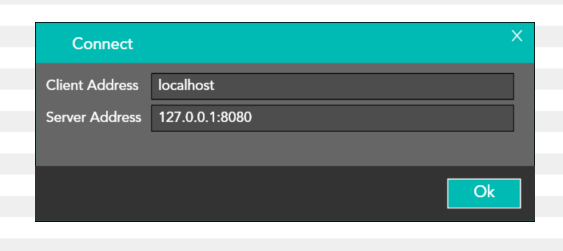
The address of the machine on which the debug session is running must be entered in the client address textbox.
Typically localhost is entered as the debug section runs on the same PC on which Kreo is installed.
The IP address of the target machine on which the Kreo project is running must be entered in the Server address textbox.
The connection port is fixed and is 8080.
Once you press OK the debug console connects to the target device.
-
PAUSE: pauses the execution of the script and forces it to restart.
-
STOP: Stops the debug session from running and forces the debug console to log out
-
CHANGE BREAKPOINT: once the cursor is positioned on a line of code where there is a breakpoint it allows it to be toggled
-
REMOVE ALL BREAKPOINTS: Removes all breakpoints from the code
-
NEXT INSTRUCTION STEP OVER: allows you to move on to the next instruction by skipping the subfunctions
-
NEXT STEP INTO STATEMENT: allows you to move to the next subsequent instruction within the function
-
NEXT STEP OVER INSTRUCTION: allows you to move to the next instruction outside the function
Application debug
Once the script execution has started and a breakpoint has been inserted, the program execution will stop on the break statement and the cursor will be identified by the yellow arrow.
Watch window
On the right side the user can insert variables (both local and global) and see their value both during script execution and in stop state.
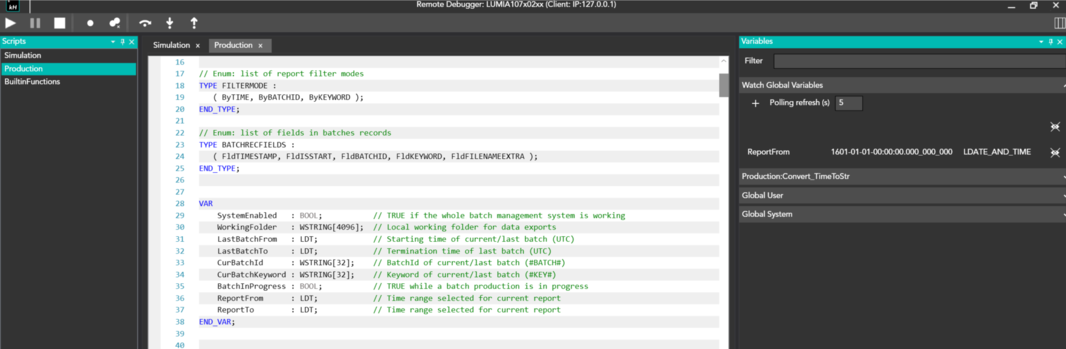
There is no limit to the number of variables that can be inserted in the watch window.