Domain management command toolbar
The Kreo Connect toolbar is on top of the page and inside it the user can find the different icons for the main commands.
1- Add a network
This is the very first step for the domain programming.
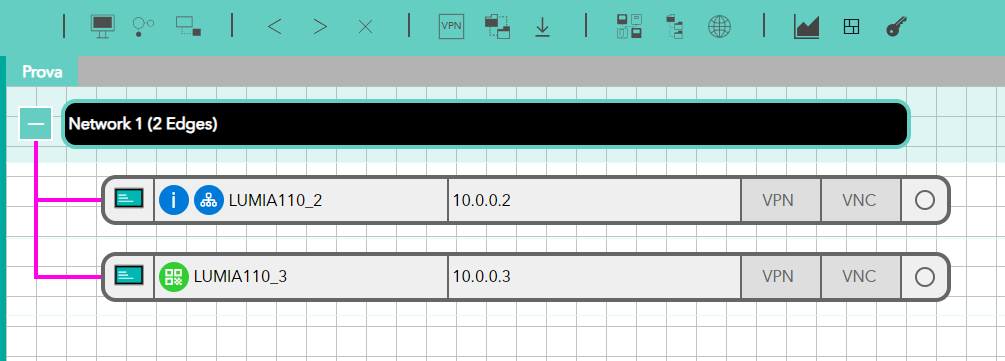
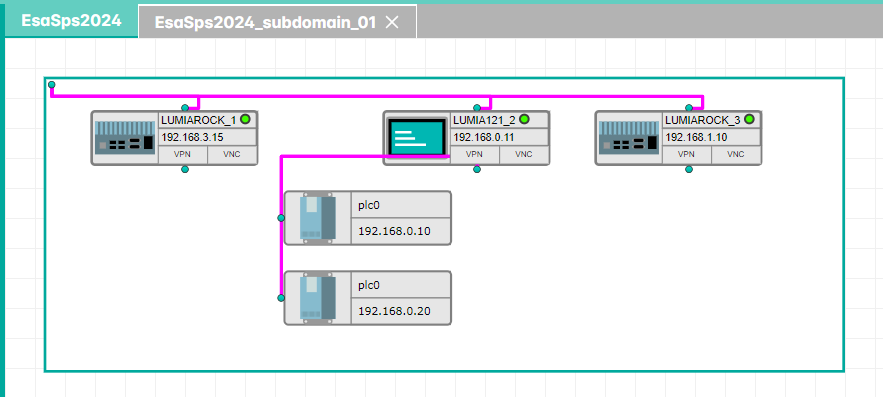
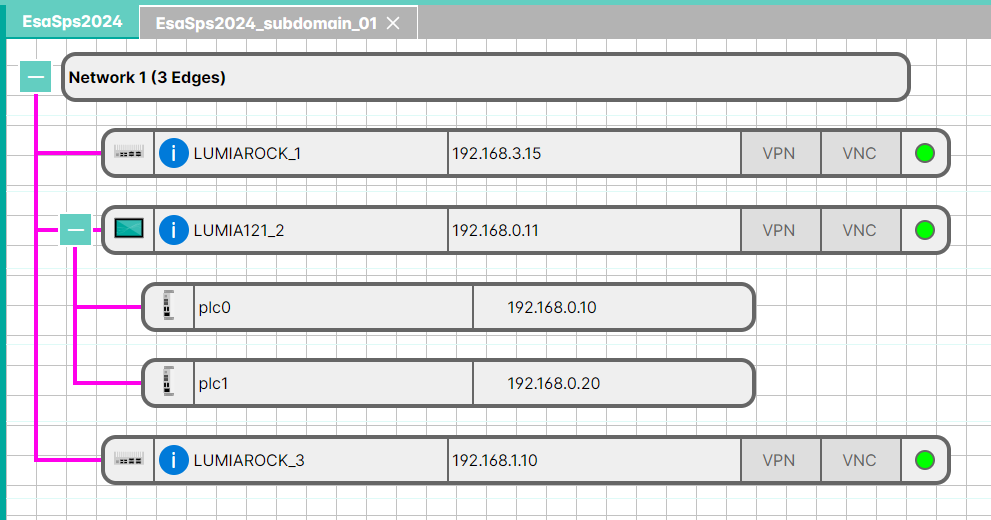
The Network represents the application (both machine or network of machines) and the edge device have to be inserted inside a network.
The network can be added both on treeview mode or graph mode.
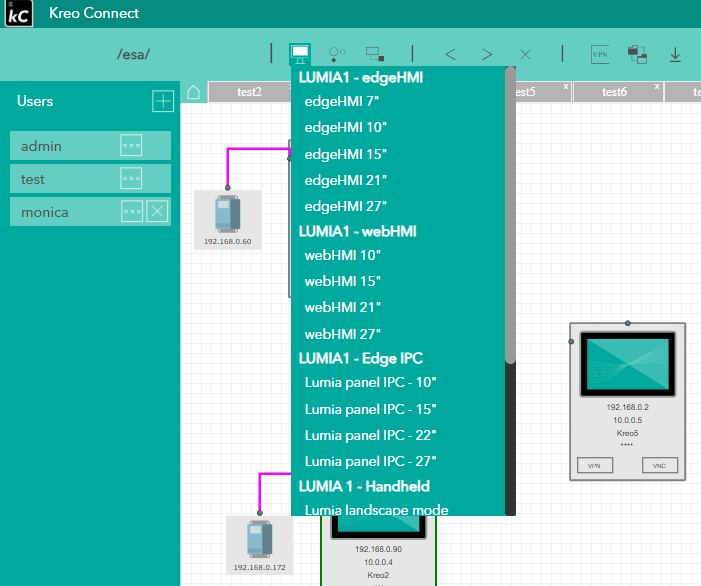
2- Add an edge device to the network
When the user click this icon, a list with all the ESA devices pops up and it is possible to select wich is the device that the customer is going to use in the application.
Drag the edge icon into one of the networks available on the canvas.
In case of Treeview visualization the network must be selected.
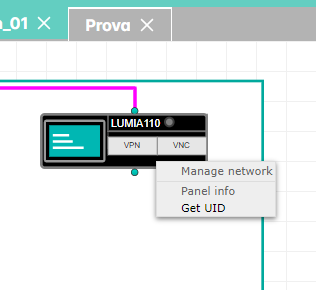
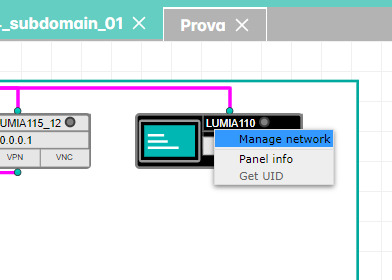
Once the edge device is placed on the canvas, the user via the click button over the network icon will display the below pop_up:
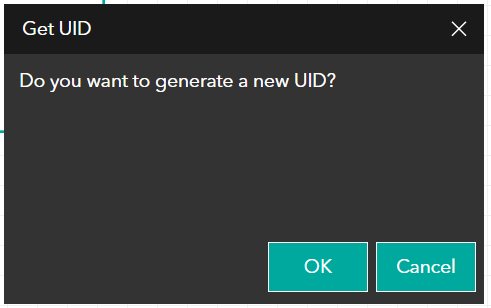
The first operation is get the UID (Unique Identifier) of the device.
This UID will have to be inserted in the device control panel in order to create the association between the domain definition and the target.
A couple of additional steps are necessary:
Press OK for the UID generation.
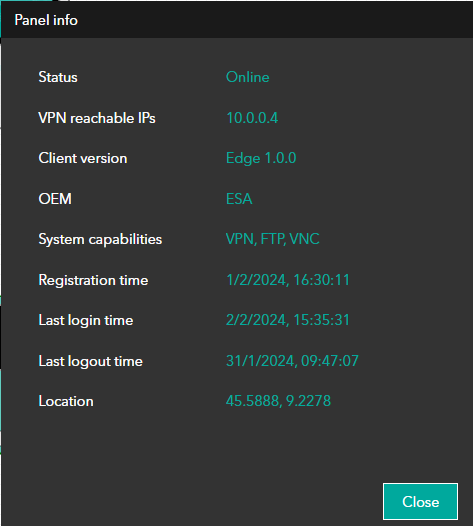
Once the UID has been generated the user can select panel info and display the GUID.
The GUID is necessary in order to complete the device configuration via the target control panel.
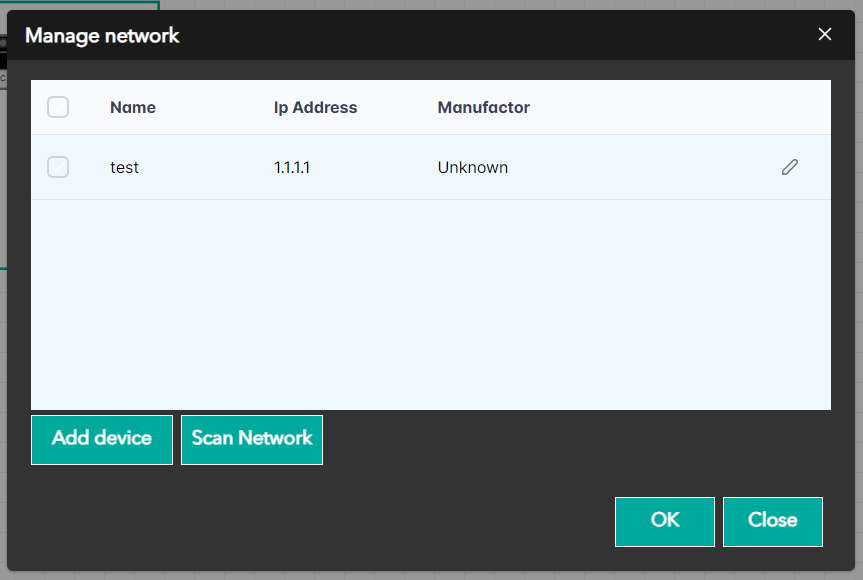
2- Define the target device belonging to the OT network
Click on the Manage Network icon
A pop_up window will be displayed where the user can define the OT network device that have to be accesed via Kreo Connect.
The user has to insert:
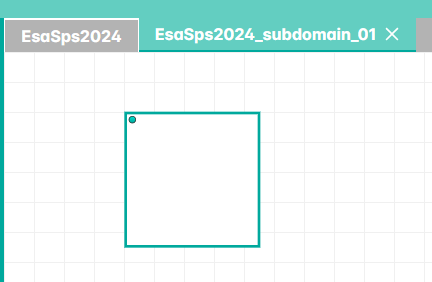
3- Add a domain
With this command the user can create embty subdomain that will be accessible via the TAB on top of the domain page.
4- Undo
Revert to the last command
5- Redo
Move ahead to the next command
6- Delete
Delete the selected element
7- Active VPN
See the dedicated sub section for the details
8- Active file transfer
See the dedicated sub section for the details
9- Active download setup
See the dedicated sub section for the details
10- Treeview mode
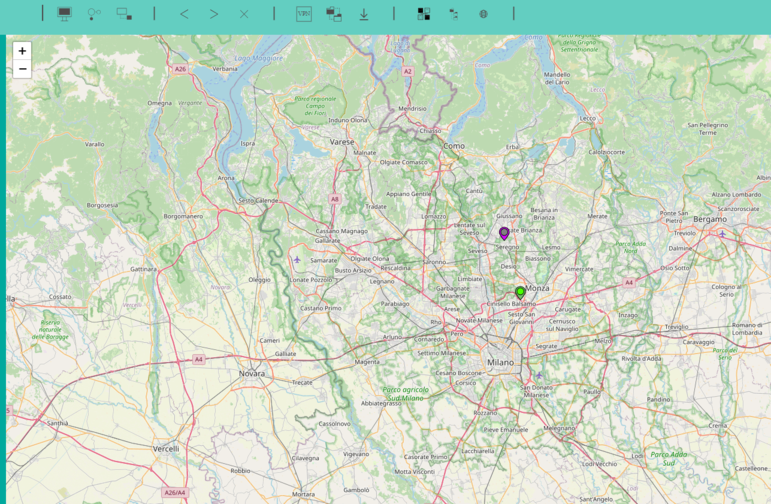
12- Geo location mode
This command will force the geo localization mode.
All the domain applications will be displayed with different background colour.
The spot inside the domain logo will identify the status:
GREEN: currently online
GREY: currently not online. The position is the one corresponding to the last online condition
RED: error
7- Statistic
This window displays the domain traffic data divided into three main types:
VPN (virtual connection tunnel)
Vnc (remote desktop)
Ftp (file transfer)
In the lower part it is also possible to set display filters and see the traffic divided by users.
8- Dashboard
The dashboard provides a simplified view of domain data.
9- License
Page dedicated to viewing the registered licenses and inserting the new licenses necessary to manage traffic.